Until today, Reports in LawnBeast was one page — a couple of charts, and a column of greyed-out links underneath them. As of this morning it's a Reports hub plus 11 dedicated reports, 12 pages in total, all running on your own live data. Every one of them is available to every contractor on every plan, including free accounts.
01What replaced the old Reports page
The old page gave you a snapshot and nowhere to go from it. You could see a chart, but you couldn't ask it a second question — which customers are behind, which services are actually carrying the year, which quotes went quiet.
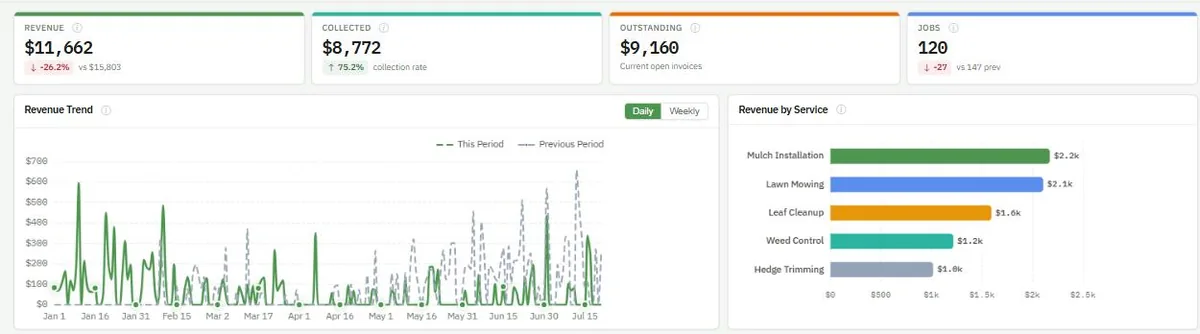
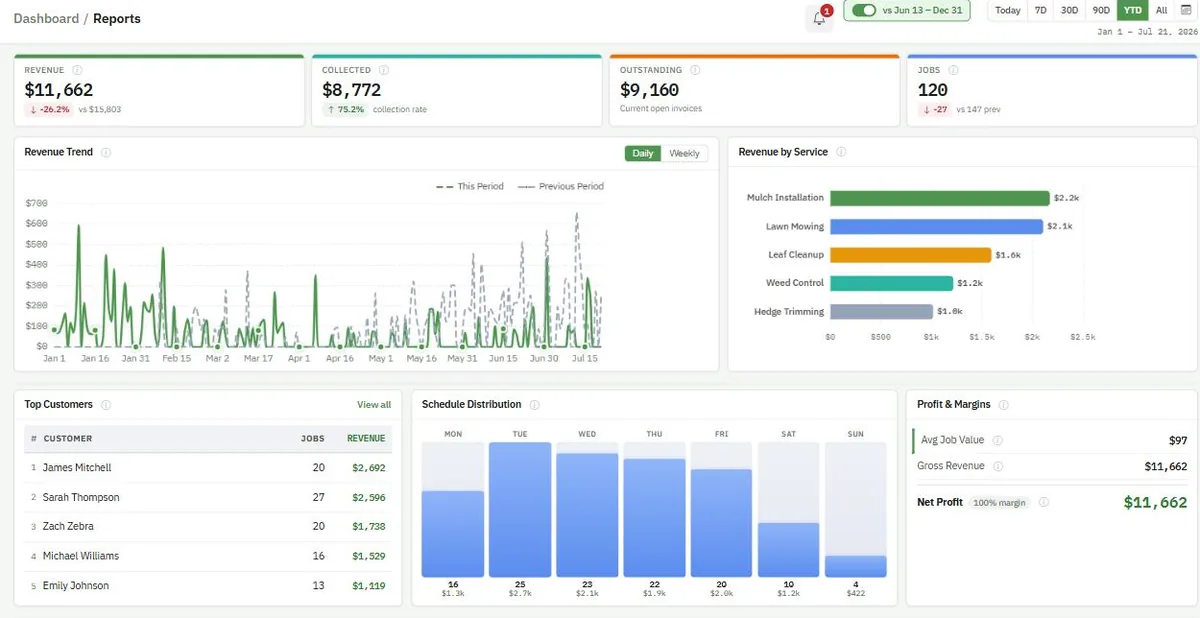
The new Reports hub keeps the top-line view and adds the drill-down underneath it. Four headline KPIs sit at the top: Revenue, Collected, Outstanding, and Jobs. Revenue is compared against the previous period. Collected shows a collection rate rather than a comparison. Outstanding is a live snapshot of your currently open invoices, so it has no period comparison and ignores the date filter on purpose — money owed is money owed regardless of which window you're looking at. Below the KPIs: revenue trend, revenue by service, top 5 customers, weekday schedule distribution, profit & margins, and team performance.
Everything is reached from Reports in the dashboard sidebar.
02The 12 pages
| Page | What it shows |
|---|---|
| Reports Dashboard | The hub — four headline KPIs plus revenue trend, revenue by service, top 5 customers, weekday distribution, profit & margins, team performance. |
| Revenue Report | Revenue trend with a dashed prior-year overlay, recurring vs one-time mix, revenue by service, a collection waterfall, top-10 customers, a year-to-date calendar heatmap. |
| A/R Aging Report | Five aging buckets by invoice and by customer, total outstanding, total overdue, 90-day collection rate, average days outstanding. |
| Customer Retention | Every customer classified Active / At-Risk / Churned, each with a suggested next action, plus average lifetime value and an active-customers trend. |
| Quotes Pipeline | Total quotes, conversion rate, pipeline value, average deal size, a three-stage funnel, weekly trend, status donut, 20 most recent quotes. |
| Jobs Report | Completion rate, cancellation rate, average job value, job volume trend, schedule density, recurring vs one-off mix, cancellation analysis, per-team throughput, payment-method split. |
| Services Report | Service revenue ranking, service mix over time, a growth matrix, an all-time seasonality heatmap, discount impact, a cross-sell suggestion from your top two services. |
| Top Customers | Customer revenue ranking, value histogram, lifecycle segments (based on all-time activity), revenue-per-customer trend, tenure-vs-value scatter, payment behavior, action items. |
| Automation & Tools | Automated actions run on your behalf, emails sent, pre-authorization success rate, how many of 8 automation features are switched on, activity trend, category donut, settings grid. |
| Email Activity | Emails sent, delivery rate, open rate, suppressed count, volume by email type, the 20 most recent suppression entries, group messages. |
| Payment Automation | Payment events, pre-authorization success rate, auto-generated invoices, reminders sent, an invoice funnel, your auto-invoicing rules, reminder effectiveness. |
| Leads & Website | Form submissions, contact inquiries, reviews received, average rating, lead trend, rating distribution, recent forms and reviews. |
03The two we'd open first: A/R Aging and Revenue
A/R Aging sorts every open invoice into five buckets — Current, 1–30, 31–60, 61–90, and 90+ days — each with a dollar total and an invoice count. You get the same money two ways: a per-invoice list for chasing a specific job, and a per-customer summary for the harder conversation about a whole account. Four KPIs sit above it: total outstanding, total overdue, collection rate over the last 90 days, and average days outstanding, weighted by balance so one small ancient invoice doesn't distort the number.
Revenue puts this year's trend line against a dashed prior-year overlay, splits recurring from one-time work, ranks revenue by service (top 8 plus "Other"), and runs a collection waterfall — invoiced, then outstanding, then overdue, then collected. It also flags customer concentration: if your top 3 customers are more than 30% of revenue, the report tells you. The calendar heatmap on that page covers January 1 through today — year-to-date, not a rolling full year.
04Retention is judged against each customer's own cycle
Calling a customer "late" only means something relative to how often you serve them. So for any customer on a regular service frequency, Customer Retention keys the thresholds to their cycle: at-risk once they're past 1.5x their normal interval, churned past 3x. A weekly customer and a monthly customer are held to different clocks, which is the only fair way to do it. Customers with no established frequency fall back to fixed windows of 45 and 90 days.
Every customer lands in Active, At-Risk, or Churned with a suggested next action attached — Priority outreach, Send re-engagement offer, Win-back campaign, or Seasonal check-in — alongside their total spend and your average customer lifetime value.
05How the headline numbers are calculated
Rates are easy to fudge, so here are the exact definitions we used:
- Quote conversion rate = accepted ÷ (accepted + declined). Decided quotes only, so quotes still sitting open don't quietly drag the number down.
- Pipeline value and average deal size are pre-tax.
- Job completion rate = completed ÷ (completed + cancelled). Cancellation rate = cancelled ÷ total scheduled.
- Collection rate on A/R Aging covers the last 90 days.
- Average days outstanding is balance-weighted.
- The quotes funnel has exactly three stages: Total Quotes → Open/Sent → Accepted.
06Set the date range once and it follows you
Most reports offer last 7, 30 or 90 days, year-to-date, 12 months, all time, or a custom range. The range you pick persists in your session and carries from one report to the next, so you set it once and every page you open next is already on the same window.
Five deliberate exceptions, so nothing surprises you:
- A/R Aging has no date-range picker. It uses an "As of" date instead, because aging is measured from today backwards.
- Customer Retention uses a 3M / 6M / 12M lookback rather than a custom range.
- The seasonality heatmap on the Services Report is all-time and ignores the date filter — seasonality needs full history to mean anything. It covers your top 12 services.
- Outstanding on the hub ignores the date filter and always shows currently open invoices.
- Lifecycle segments on Top Customers are based on all-time activity, not just the selected period.
07Free on every plan
There is no plan gate on any of the 12 pages. Not a tier check, not a subscription check, not a feature flag. If you can log in as a contractor, you have all 12 reports, including on a free account. There is nothing to upgrade to and nothing to switch on.
Every report, on every plan. Free accounts included, with nothing held back as an upgrade.
One honest caveat: every page is built from your own records, and there are no demo numbers. A young account will see thin charts until the jobs, quotes and invoices are in.